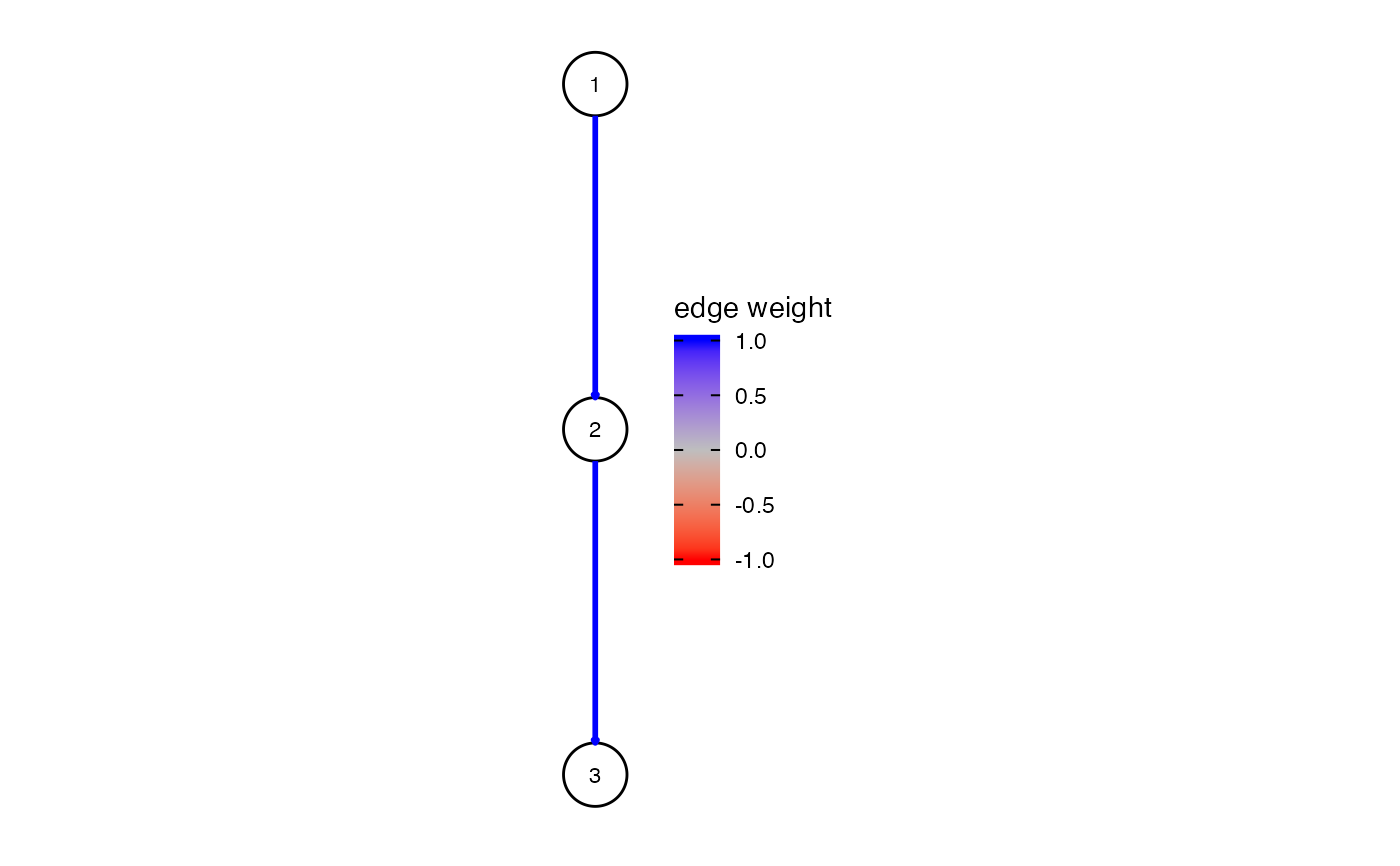
Generic function which plots any adjacency matrix (assumes DAG)
plot_network(
  adja_matrix,
  nodename_map = NULL,
  edgescale_limits = NULL,
  nodesize = 17,
  labelsize = 3,
  node_color = "white",
  node_border_size = 0.5,
  arrow_size = 0.05,
  scale_edge_width_max = 1,
  show_edge_labels = FALSE,
  visualize_edge_weights = TRUE,
  use_symlog = FALSE,
  highlighted_nodes = c(),
  legend_title = "edge weight",
  value_matrix = NULL,
  shadowtext = FALSE,
  ...
)
Arguments
- adja_matrix
Adjacency matrix of network
- nodename_map
node names
- edgescale_limits
Limits for scale_edge_color_gradient2 (should contain 0). Useful to make plot comparable to others
- nodesize
Node sizes
- labelsize
Node label sizes
- node_color
Which color to plot nodes in
- node_border_size
Thickness of node's border stroke
- arrow_size
Size of edge arrows
- scale_edge_width_max
Max range for `scale_edge_width`
- show_edge_labels
Whether to show edge labels (DCEs)
- visualize_edge_weights
Whether to change edge color/width/alpha relative to edge weight
- use_symlog
Scale edge colors using dce::symlog
- highlighted_nodes
List of nodes to highlight
- legend_title
Title of edge weight legend
- value_matrix
Optional matrix of edge weights if different from adjacency matrix
- shadowtext
Draw white outline around node labels
- ...
additional parameters
Value
plot of dag and dces
